James E. Clayson
American University of Paris, Paris, France
Abstract
In 2006, Jeanette Wing announced—in a very short, three-page paper—a new discipline she labelled ‘Computational Thinking.’ This new field, CT, she said, is not the same as just programming, because it also includes the energies, constructs and ambitions behind programming—such as problem-solving, heuristic and algorithmic thinking, data manipulation, abstraction, reduction, transformation, generalization, data manipulation, and pattern finding.
Wing asserts that CT is an important methodology for learning in general, and that CT’s benefits extend into ‘all parts of life.’ If this claim is true, then CT should be crucial not only for students of STEM subjects—who already use computational methods—but also for those studying disciplines traditionally associated with the humanities, qualitative social sciences and arts and letters. But where are the voices from these other fields? Where are the studies of observed learning when computational methods are applied within these other non-STEM subjects? And where do we find instances of new kinds of thinking emerging from this mix?
I want to address these questions in a personal and idiographic way. I describe the history, activities and outcomes of a university-level course I invented, called Visual Modelling. The course required students to intermingle computational methods with drawing and design tools. Using words and images I explain some of the ideas and procedures that emerged over the fifteen years of co-teaching this cross-disciplinary course. Everyone participated in the ongoing back-and-forth translation between the different notational languages, everyone benefited, and this level of engagement became its own source of fluency, energy and inspiration.
Keywords
Computational thinking; visual modelling; cross-disciplinarity; emergence; notational languages; translation; journaling
The secret of what anything means to us depends on how we’ve connected it to all the other things we know. That’s why it’s almost always wrong to seek the ‘real meaning’ of anything. A thing with just one meaning has scarcely any meaning at all.
Marvin Minsky (1987, p. 64)
Setting the scene
Full disclosure: I was educated in STEM-centred universities where I studied engineering, statistics and operations research before heading a group of mathematical modellers in a large corporation. I am now Professor Emeritus of mathematics and computer science at a private liberal arts university in Paris. As a retired academic I finally have the time—and the need—to reflect on how my experience working in this liberal arts environment, so different from my own education, gradually transformed and expanded my sense of the power of computation to amplify methodologies used in other fields.
I find myself increasingly concerned that most of the research now being done on Computational Thinking (CT) is focused on the use of coding as a stand-alone subject or for teaching STEM courses (Kite et al., 2021). This seems to reduce learning to solving set problems rather than helping students to construct models suitable for exploring more ambiguous spaces where a variety of different skills will likely be needed. One outcome of such a narrow approach is its limiting of pedagogical experimentation in other non-STEM fields and its allied discouragement of developing cross-disciplinary studies that could help address the major issues of our time.
In this paper I will describe how my interest in visual modelling was kindled right after graduate school and has remained a life-long focus in my teaching and pedagogical research.
Lessons learned in industry
In 1963 I was hired as part of a small pioneering operations research group tasked with constructing computational models in a large multinational corporation to help them achieve their social, cultural and financial goals. In order to do so our team had to explore and model mathematically the interactions among people, goods, ingredients, markets, transportation, manufacturing, distribution facilities and financial constraints as parts of an integrated whole. But how?
As we discovered, visual tools were indispensable to this task. For example, diagrams of the flow of materials through a complex purchasing, manufacturing and distribution network helped our team to discuss, define and develop our model and scenarios for improving it. Until we ourselves could agree on this, we were not yet ready to present our proposals to management for further critiquing and feedback. In this way I learned first-hand the power of visual modelling to communicate with people across different disciplines, and thus to engage them in defining and supporting a common project.
We were immensely fortunate that my boss had given me one of the first commercially available interactive computer terminals in the United States. This terminal, designed specifically to run Ken Iverson’s APL programming language[1], proved transformative: we now had access to a computational tool that allowed us—on the spot—to build small models and try them out. To appreciate the impact of this desktop gift, we need to remember that in the late 1960s computers were room-sized machines not amenable to interactive model-building. This meant they were mostly appropriate for addressing problems solvable by known algorithms, but not at all helpful for exploring ambiguous problems better suited to iterative approaches and simulation. Iteration also encourages the breaking down of large problems into smaller parts that are easier to visualise, apprehend, model and manipulate.
Looking back, it is clear that this early work experience confirmed for me the importance of combining visual tools with interactive, exploratory and incremental computational modelling. When I transitioned from industry to academia I carried these big ideas with me.
Fast forward to the American University of Paris
By the 1980s I had left corporate life and was teaching operations research (OR) to computer science, economics and business undergraduates at the American University of Paris (AUP). One day over lunch with the Director of the Paris campus of Parsons School of Design (New York), I had a conversation that proved to be transformational.
Discussing our respective classes, we found that the profiles of our students were quite different. Art students, Roger said, were creative by nature, willing to explore and to play with their ideas and approaches. These were recorded as sketches, doodles, words, and diagrams in the notebooks they always carried with them. He felt, however, that they were often too easily satisfied just to have ideas; they wouldn’t follow through to investigate the relative merits of each of these ideas. For them, process was more important than the end product.
On the other hand, my own AUP students, with their STEM focus, were more interested in end product rather than process. They were after quick solutions to set problems using technical language and notation. They didn’t see any purpose for exploration because they were sure there must be an algorithm out there that would handle the problem for them. So, when they found no suitable algorithm, they were at a loss as to how to proceed. And they never used notebooks.
Cross-disciplinary visual modelling
This lunch was the moment when the idea for an experimental and cross-disciplinary visual modelling course first emerged. What would happen, we wondered, if we designed and co-taught a course that mixed art students from Parsons with my STEM-oriented students from AUP and had them all work together in small teams? We would ask them to explore open-ended tasks—as opposed to problem sets—that would require a mix of visual, narrative, math and computer programming skills. Would this create new and exciting synergies, we wondered? Our hope was that cross-disciplinary discussions between STEM and art students would broaden the perspectives of each.
By the time coffee was served, my conversation with Roger had strayed into an exchange of views on the longer-term cultural impact of personal computers that were just arriving in homes, offices and schools. It was clear to us both that they were already revolutionising how we think, how we perceive and how we communicate. Since the computer was necessarily an integral part of our course on visual modelling, Roger and I wanted to ensure that students understood that they would be using the computer and programming as a tool to explore and enhance their appreciation of the physical world, rather than as an end in itself.
Here is our catalogue description of the proposed Visual Modelling course:
This course looks at computing skills and applications in a non-traditional way. Using the computer language Logo[2], we will construct computational environments to examine how we look, think, and feel as we go about making sense of objects around us. We will explore such complex modelling areas as: tile design, works of art, organic forms, alternative spatial systems, visual data analysis, concrete poetry and book cover designs.
Over the next thirty years I taught three series of visual modelling courses. First at Parsons School of Design Paris, then at AUP, and finally at Deep Springs College[3] in California. Examples of my visual modelling activity during this long period are included in Clayson (1985, 2008, 2018, 2020, 2021).
Throughout this time, visual modelling’s ability to attract students from a wide range of academic backgrounds and interests reinforced my faith in the validity of this cross-disciplinary and open-ended approach: Yes, students would learn the big ideas of computer science and do significant amounts of actual programming; but the intent would always be focussed on expanding powers of observation, description and aesthetic sensibility.
Tile designs: Example of a visual modelling assignment
For this assignment on tile design, I wanted for us to talk first as a group about how to identify themes in specific tile designs that could later be explored computationally. I picked two quite different designs from a book[4]. One features a fairly tangible physical shape, while the other displays overlapping forms.
The first design, Figure 1a, is a field of rather complex core elements that fit together like identical pieces of a jigsaw puzzle. Figure 1b highlights in red a single core element made up of little V-shapes that are fixed to each side of a hexagon. I have placed a red dot in the centre so we can see more easily how the Vs rotate around it and mesh.
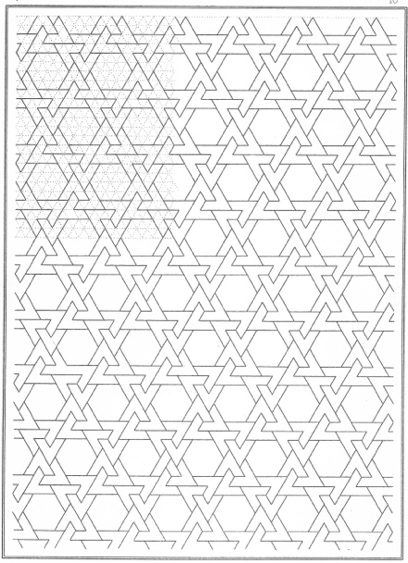
Figure 1a. Original tile
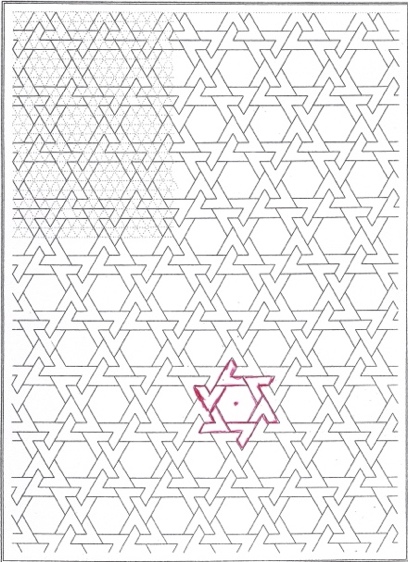
Figure 1b. Highlighted core element

Figure 1c. Enlarged core element
Figure 1c shows an enlarged version of the core element, on the left in outline form and, on the right, with alternating black and white Vs.
Having identified and isolated our core element we then advance to the computational part of the exercise for reconstructing Figure 1a. First, we need to write a program to draw Figure 1c and then write another one to place these elements into a matrix. The object is to fit the pieces together without overlap or gaps. These two programs must be generalised so that each of their characteristics—such as radius of hexagon, width of the Vs, the thickness of the lines, colours, number of rows and columns, distance between rows and columns, and the degree of indentation—can by changed by altering the values assigned to program arguments.
In other words, the real task here is not just to duplicate the existing tile design but to play with the arguments to see what surprises might come about.
Figure 2a, like our first example, shows a design composed of a core element repeated in a matrix. But unlike Figure 1a, our second design features overlapping lines. As before, I have highlighted in red the core element and have placed a red dot at the centre of the three-blade windmill.
Figure 2c illustrates what happens when two windmills overlap. Suddenly, surprising new shapes emerge, such as the tiny orange triangles formed by the overlapping of two core elements. In other words, something unexpected has happened. The willingness to alter argument values, thus generating new and even distorted patterns, is central to the concept of visual modelling.
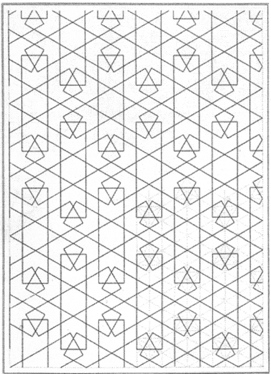
Figure 2a. Original tile
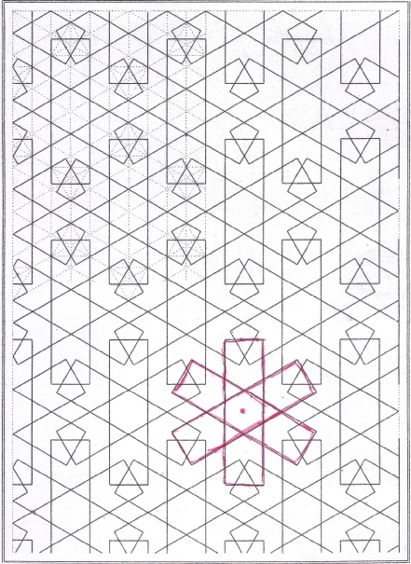
Figure 2b. Highlighted core element
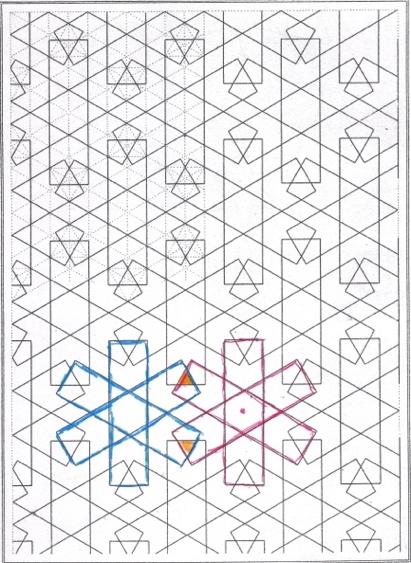
Figure 2c. Overlap of core elements
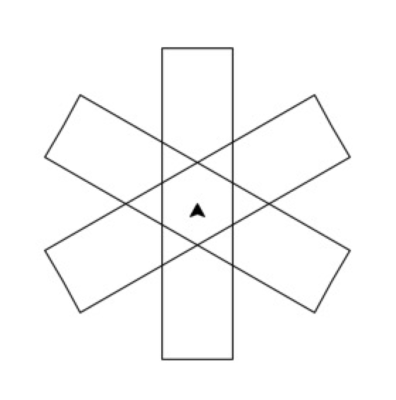
Figure 2d. Enlarged core element
As we worked our way through these tasks and others, we were each expected to keep a journal in which we recorded our explorations and findings, just as art students do in their notebooks. Journaling is an indispensable, yet totally undervalued, vehicle for self-reflection and better understanding of how our personal thought processes function and how we go about making sense of the world[5].
An outstanding tile project: Watching one student’s thought process
This particular individual made it clear that she didn’t find any of my proposed tiles of any interest and wanted to work on something she had found on her own.
Deconstruction
The core tile in her design is tricky because it is a composite matrix of four smaller core elements. In Figure 3a, we see them here outlined in red. In the next figures (3b-3g) we see how she proceeds to deconstruct each of these into their respective component parts.

Figures 3a-g
Reconstruction
Having very elegantly deconstructed the core elements of her tile, the student then set about translating the visual model into a simple computer program that allowed her to reconstruct these themes. Summary Figure 4 shows her simple sketch of the fundamental geometric forms needed to do so. She called this program ‘colourSlice’. It had arguments for the number of sides of the polygon from which the slice would be drawn, the size of the polygon, its colour, and its orientation around the dot in the centre. In Figure 5 we see how she reassembled parts of the core element.
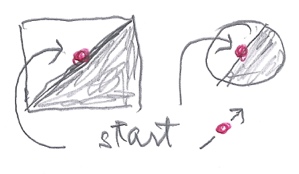
Figure 4. Coloured half slices
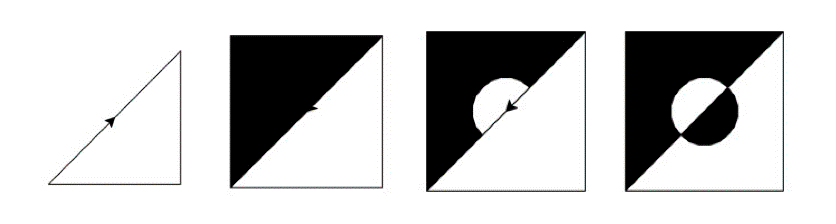
Figure 5. Construction of core tile with half slices
She then had two placement tasks.
Placement task 1: building the core tile cluster.
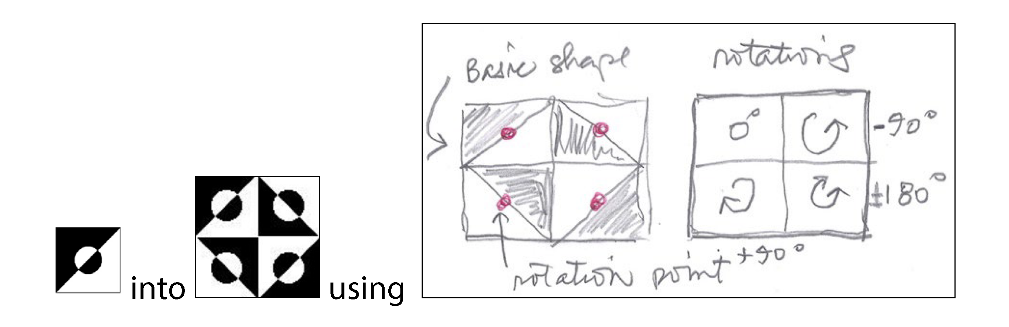
Figure 6.
Her hand-drawn sketch in Figure 6 shows the rotations needed in order to place the basic design of Figure 5 into a 2-row by 2-column matrix.
Placement task 2: putting the core tile cluster into a larger matrix.
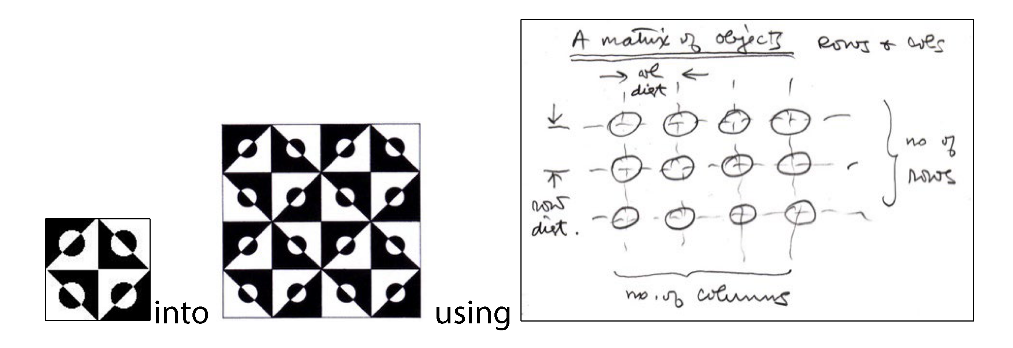
Figure 7.
Et voila! The deconstruction and the reconstruction have been achieved.
Exploration
Now comes the exciting part: exploring how this student’s program could also be used to generate a wide variety of surprising and strange images by simply altering one or more of the arguments. She proceeded to play with her programs and produced a great number of wonderful images (see Figure 8a-8f), many revealing weird emergent patterns. Note that the last tile in this series, Figure 8f, even illustrates several layers of emergence. It also seems unstable; it wobbles.
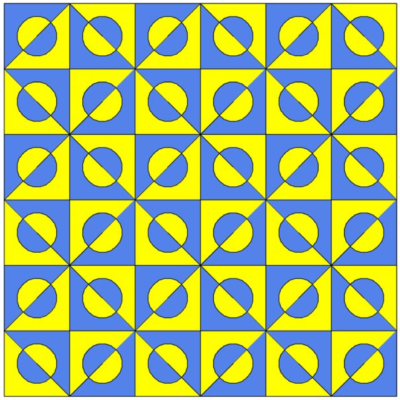
Figure 8a.
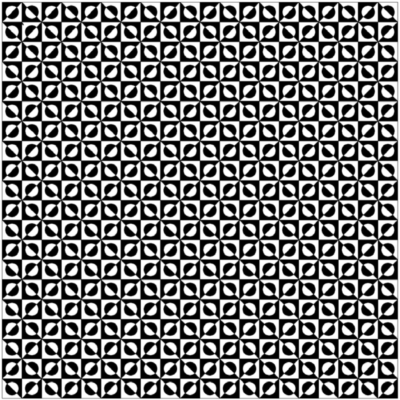
Figure 8b.
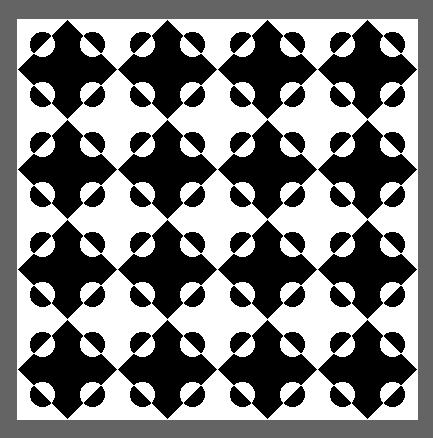
Figure 8c.
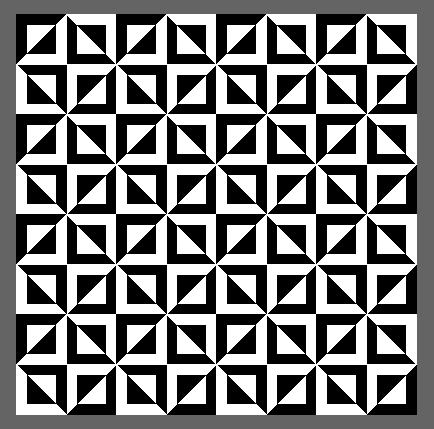
Figure 8d.
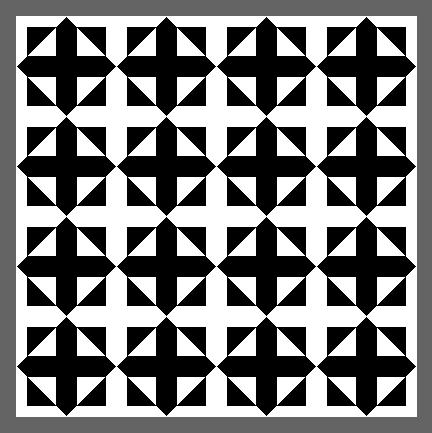
Figure 8e.
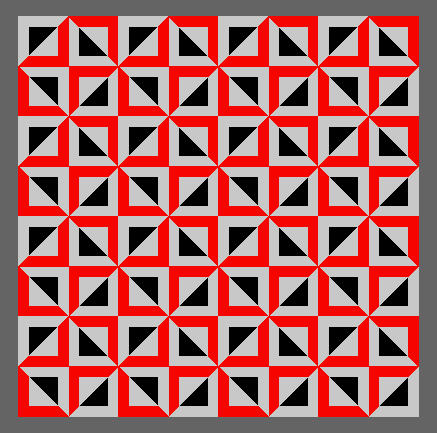
Figure 8f.
In closing
This tile design example is only one of a whole suite of visual modelling tasks, but they all share a common intention: an ongoing obligation for each student to figure out how to translate[6] between two different notational languages, and to record their progress. Each task, whether tile designs, tree shapes or themes found in paintings, is designed to help students develop their fluency and ability to document their own thought processes as these emerge along the way. This, along with basic programming skills, leads to expanded powers of conceptualization, observation, self-reflection and aesthetic agency. In other words, cross-disciplinary courses can accomplish much of what advocates of computational thinking are promoting.
Our vocabulary and insistence on the importance of process and exploration may seem very different from what characterizes most CT courses. But this is misleading. Looking more closely, which is the point of case studies like this one, we see how a student iterates her way through a complicated task—to manipulate a tile design both visually and computationally—thus demonstrating her ability to find patterns, manipulate data, generalize, use algorithmic and heuristic tools and many of the other qualities ascribed by Wing (2006) and her colleagues to computational thinking.
I hope that accounts like mine might encourage others to discover the intellectual challenges and satisfactions that come from designing and teaching computationally enhanced, cross-disciplinary courses.
Notes
[1] APL offers a toolkit of high-level functions (e.g., one key for sorting, one key for inverting a matrix) and operators that can apply functions directly on elements of multidimensional arrays. For me, it was a perfect environment for quickly testing out ideas, heuristics and algorithms on real data. APL revolutionized my operations research activities, and my thinking, by making micro-modelling not just possible but part of a typical workday. Overnight, modelling could be brought to anyone who wanted to discuss a complex problem. APL made translation from task descriptions to a variety of computational models faster and easier. (Iverson, 1962, 1980; Perlis, 1978).
[2] Logo is a multi-paradigm adaptation and dialect of the Lisp computer language, that is easy to learn. It was designed at MIT in 1967 by Wally Feurzeig, Cynthia Solomon, and Seymour Papert (Papert, 1980; Solomon et al., 2020). Their purpose was to give younger students an environment for autonomous learning and playing with math and computational ideas. The attraction of Logo for my visual modelling class was its ‘turtle graphics’ feature, which uses a turtle symbol that can be commanded to move in space using simple body knowledge like go forward, turn left or fill shape with colour. Logo is associated with the learning theory known as constructionism that was also developed by Seymour Papert (Ackerman 2001; Papert & Harel, 1991).
[3] Teaching at Deep Springs College gave me the opportunity to update from Logo to Python, a language widely favoured in industry and research. Python has a turtle graphics module which I first needed to customize before trying it out in the classroom. I worked with several colleagues at Comenius University in Slovakia to do so. Python, like Logo, is easily learned and also offers additional features such as ‘syntactic shape.’ This feature allows the visual modeler to recognise aesthetic parallels between program logic and program output.
[4] There is a vast literature illustrating tile designs from a great number of cultures and for a large variety of uses. In addition, tiling, or tessellation of a surface with different shapes, is an important mathematical subject. For my purposes I wanted a book with a variety of tile designs but presented in simple line form (Bourgoin, 1973).
[5] There is a large literature on journaling from which I have selected two articles. Ningrum and Ariani (2020) have reviewed the recent literature on reflective journal writing; and Watt (2007) speaks about the value of reflexivity in qualitative research.
[6] New Trends in Translation Studies, published by Peter Lang, is a useful journal that presents examples of multimedia, notation and language translation plus contemporary computer technologies for supporting this work.
References
Ackerman, E. (2001) Piaget’s Constructivism vs Papert’s Constructionism. Future of learning group publication, 5(3), 438.
Bourgoin, J. (1973). Arabic Geometric Pattern and Design. Dover Publications.
Clayson, J. (1985). Visual modelling with Logo: A structured approach to seeing. MIT Press.
Clayson, J. (2008) Radical Bricolage: Building coherence in the liberal arts with art modelling and language. International Journal of Education through Art, 4(2), 141-161. https://doi.org/10.1386/eta.4.2.141_1
Clayson, J. (2018). Artifacts, visual modelling and constructionism: To look more closely, to watch what happens. Problemos, (Suppl.), 8-23. https://doi.org/10.15388/Problemos.2018.0.12345
Clayson, J. (2020). Phenomenology and visual modelling: Making the object the subject. In B. Tangney, J. Bryne & C. Girvan (Eds.), Proceedings of Constructionism 2020.
Clayson, J. E. (2021). Broadening constructionism through visual modelling: My self as subject and object. British Journal of Educational Technology, 52(3), 1143-1163. https://doi.org/10.1111/bjet.13086
Iverson, K. (1962). A Programming Language. Wiley. https://doi.org/10.1145/1460833.1460872
Iverson, K. (1980). Notation as a tool for thought. Communications of the ACM, 23(8), 444-465. https://doi.org/10.1145/358896.358899
Kite, V., Park, S., & Wiebe, E. (2021). The code-centric nature of computational thinking education: A review of trends and issues in computational thinking research. Sage Open (April-June). https://doi.org/10.1177/21582440211016418
Minsky, M. (1987). The Society of Mind. Simon & Schuster. https://doi.org/10.21236/ADA200313
Ningrum, Y., & Ariani, N. (2020). Reflective journal writing: A review of the literature. NEELS (National English Education, Language and Literature Seminar) Proceedings (pp. 305-313).
Perlis, A. (1978). APL is more French than English. APL’78 Conference, Los Gatos, CA.
Papert, S. (1980). Mindstorms. Basic Books.
Papert, S., & Harel, I. (1991). Situating constructionism. In I. Harel & S. Papert (Eds.), Constructionism (pp. 1-11). Ablex Publishing.
Solomon, C., Harvey, B., Kahn, K., Lieberman, H., Miller, M., Minsky, M., Papert, A., & Silverman, B. (2020). History of Logo. Proceedings of the ACM on Programming Languages, 4(HOPL). https://doi.org/10.1145/3386329
Watt, D. (2007). On becoming a qualitative researcher: The value of reflexivity. The Qualitative Report, 12(1), 82-101.
Wing, J. M. (2006). Computational thinking. Communications of the ACM, 49(3), 33-35. https://doi.org/10.1145/1118178.1118215
Notes on contributor
James Clayson is interested in constructionist, cross-disciplinary projects that link science and technology with the other liberal arts. His courses combine computer science ideas with those of art and design. He is Professor Emeritus of Mathematics and Computer Science at the American University of Paris.
American University of Paris, Paris, France
![]() james@clayson.org
james@clayson.org